5 features you didn't know about Chrome DevTools
CommentsUmar Hansa is doing an amazing job these days: he created a daily newsletter with DevTools tips, in the form of an animated gif. Here is the my very personal top 5.
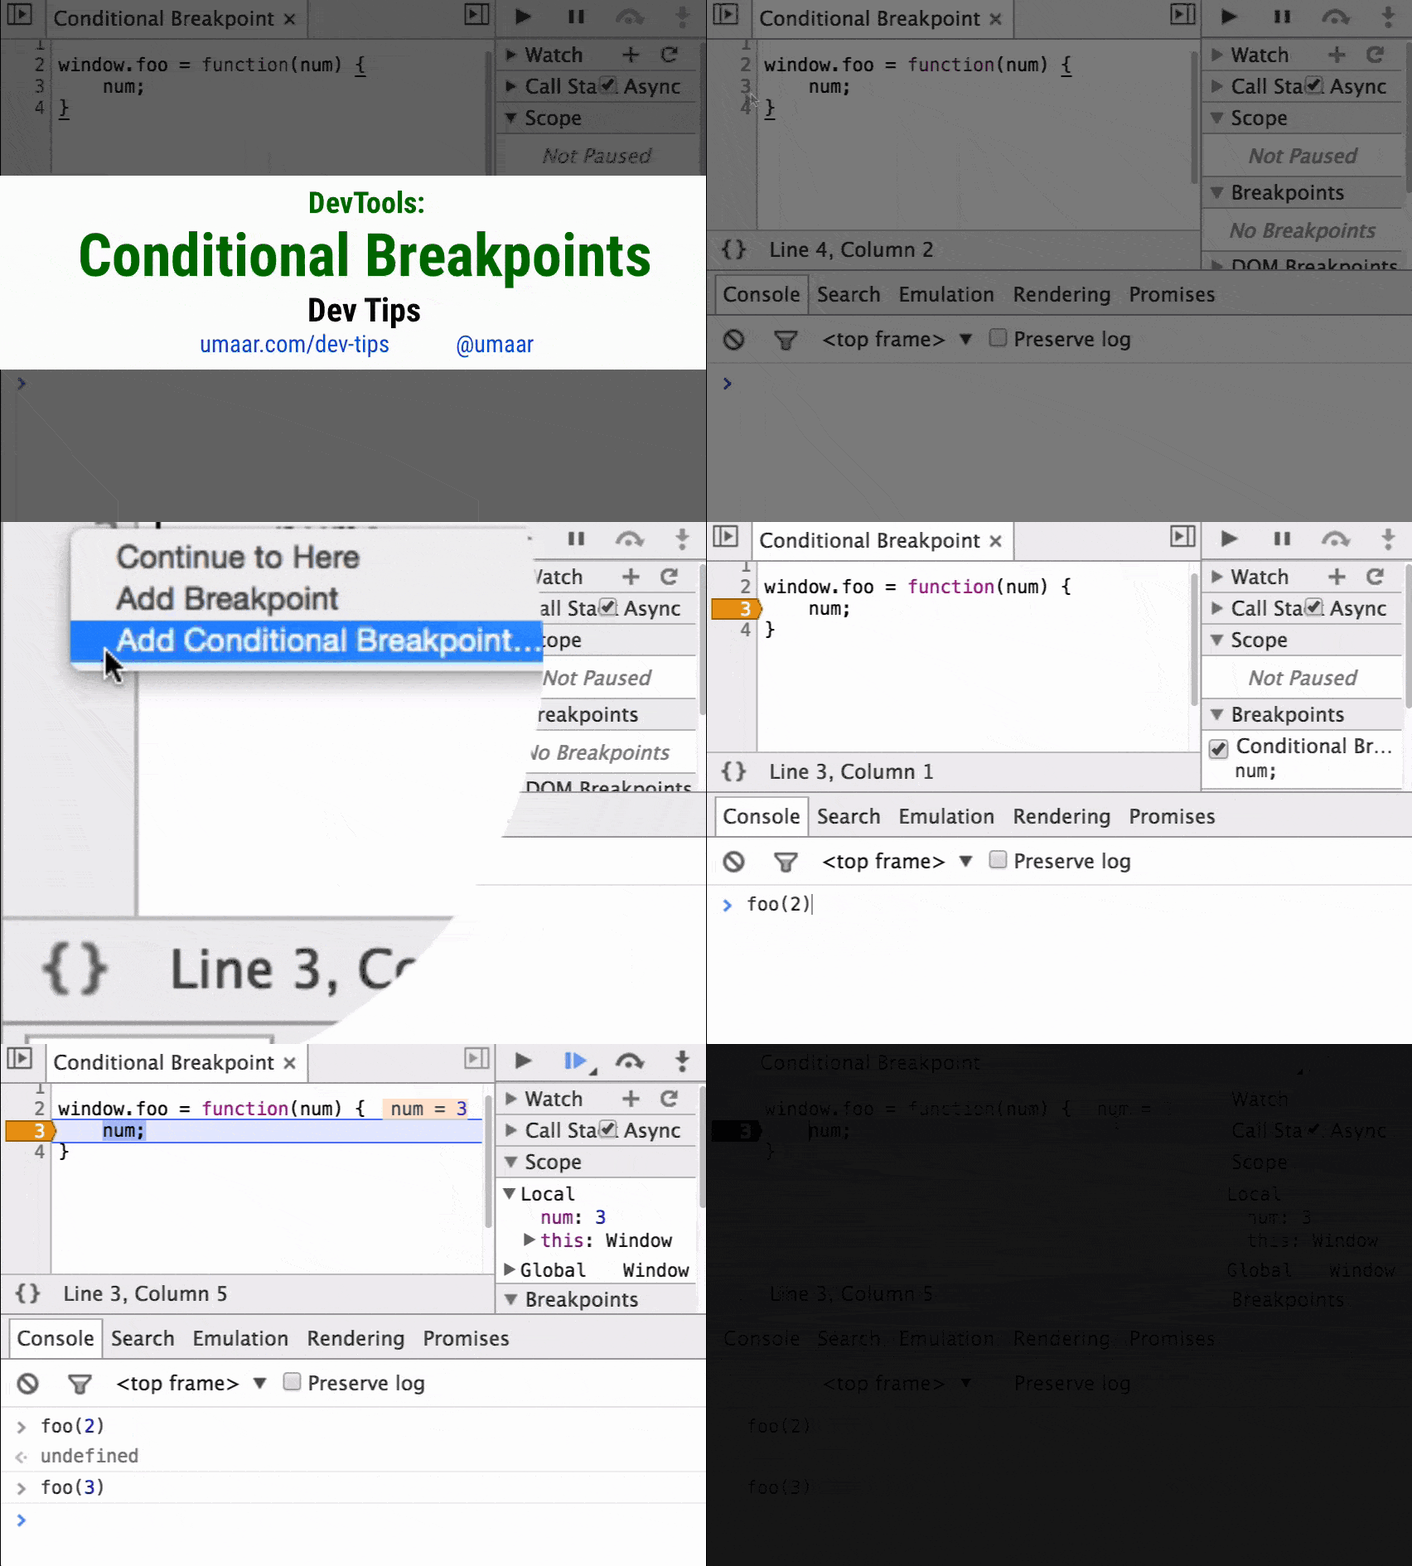
#5 Set a breakpoint based on a certain condition
When you set a breakpoint, you can make it conditional based on the result of an expression. Right click on the line gutter and select Add Conditional Breakpoint and enter your expression.
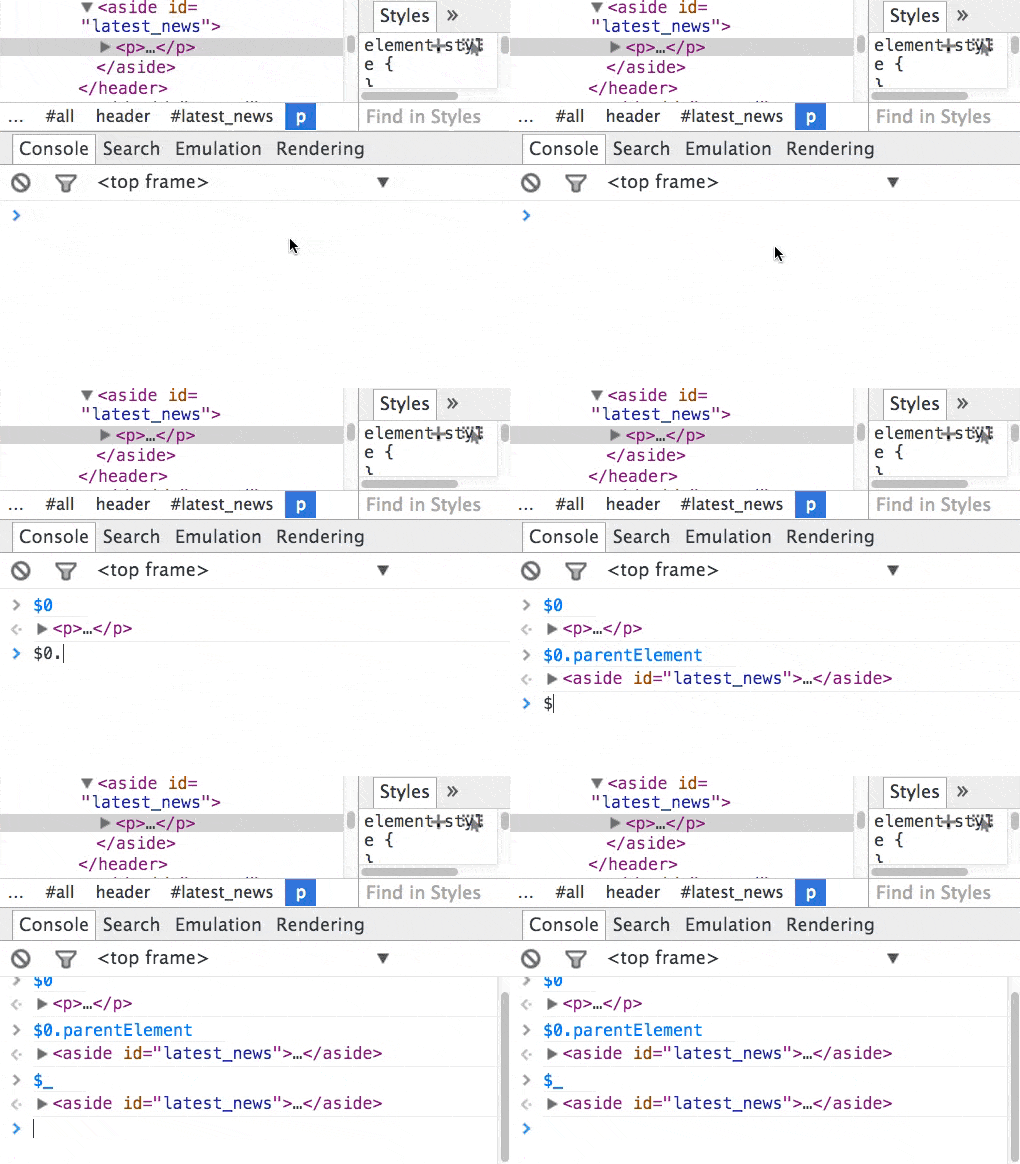
#4 Shortcut to get the currently selected DOM node
When you have a node selected in the Elements panel, use $0 to access it in the Console panel. On this subject, you can also use $_ to access the value of the most recently evaluated expression.
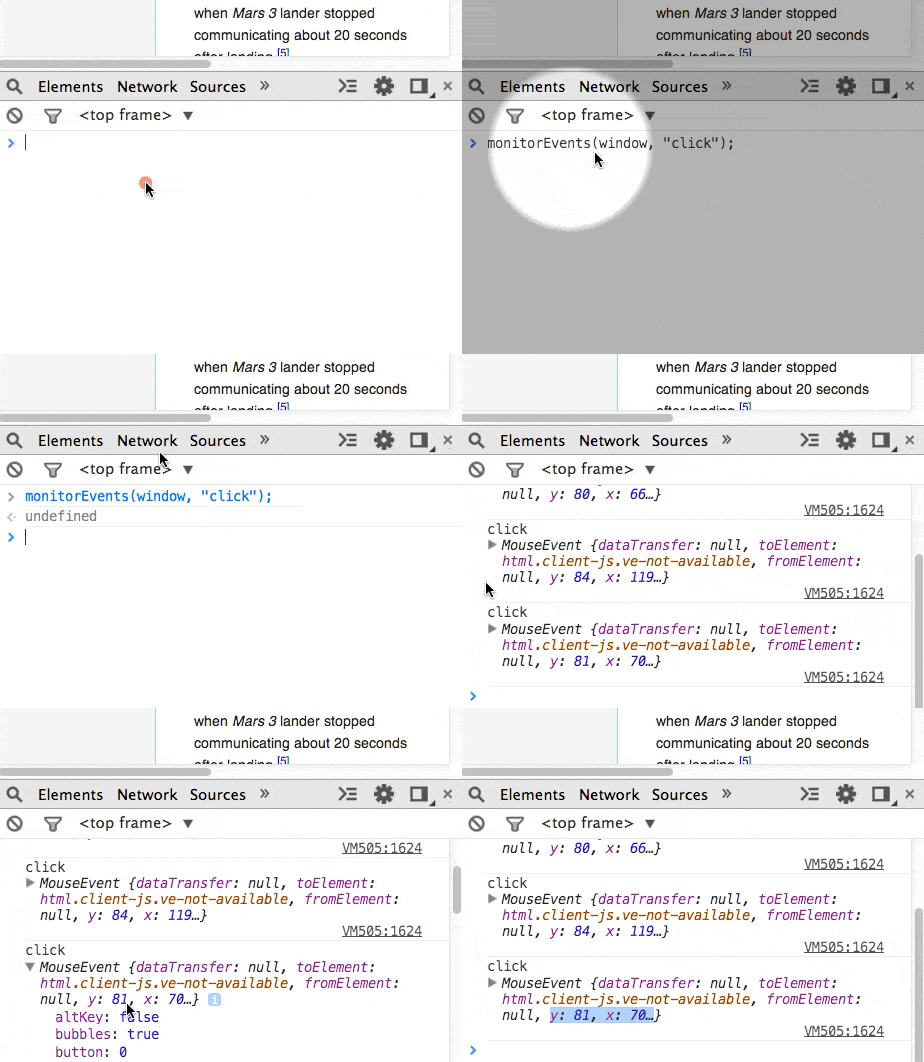
#3 Quickly monitor events from the Console Panel
You can log all the events dispatched to an object using the Command Line API method monitorEvents(object [, events]). The event objects are then logged to the Console. Useful when you need a reminder of the available properties on the event object.
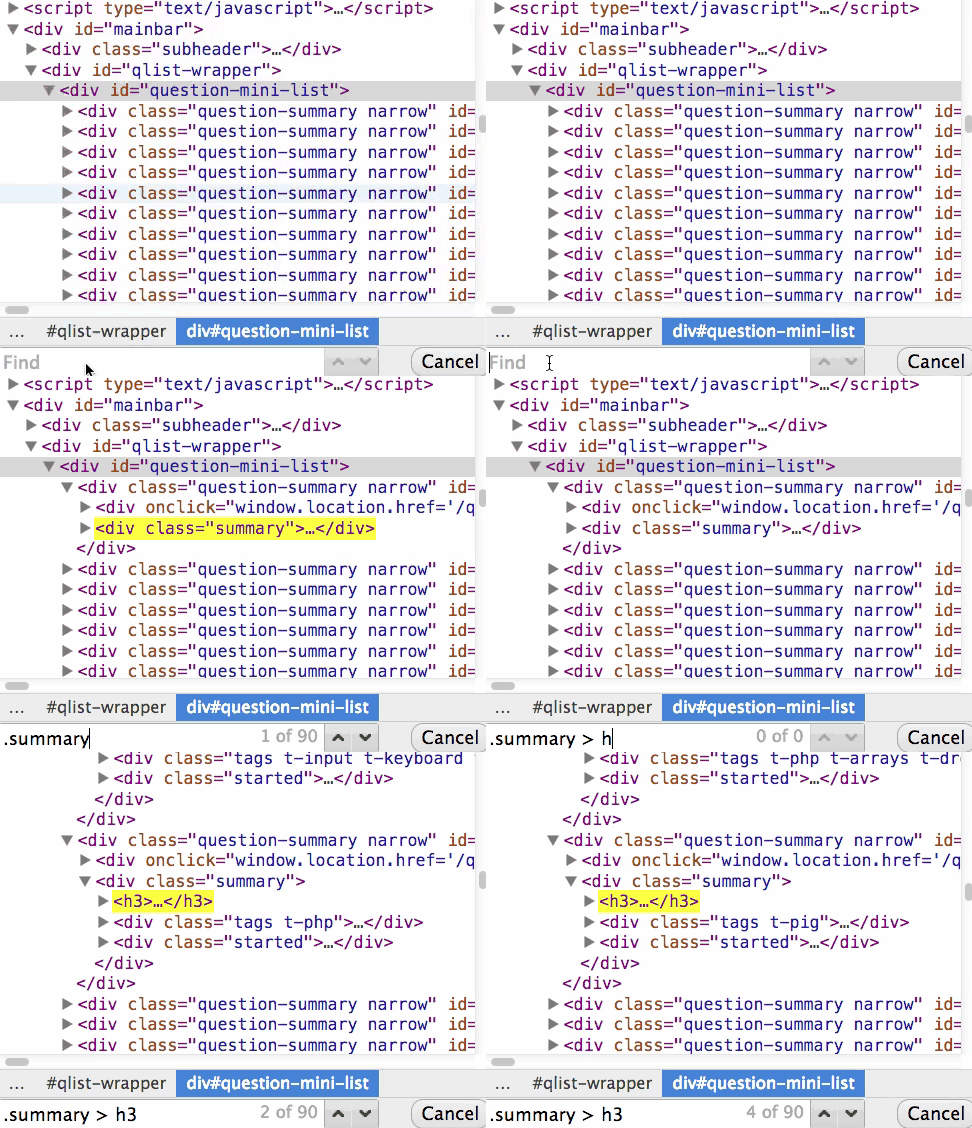
#2 DOM tree search by CSS selector
When browsing the DOM with the Elements panel, try searching (CMD+F) for nodes by their CSS selectors.
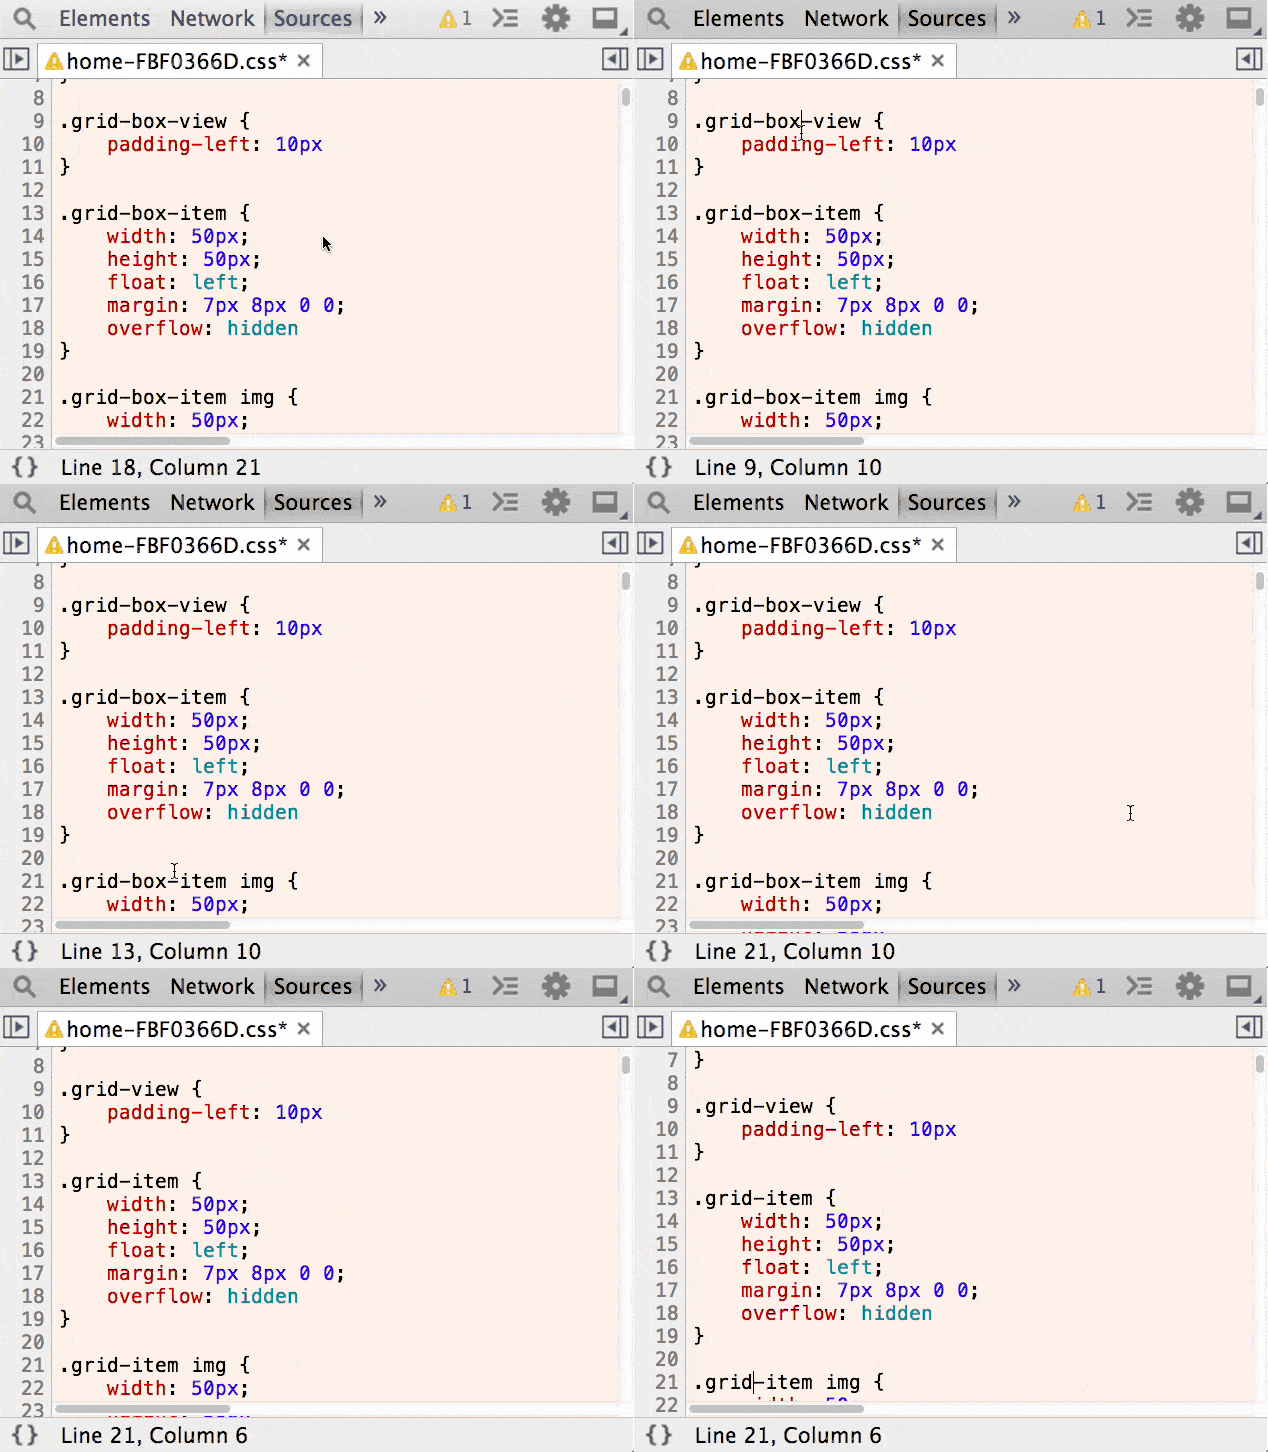
#1 Multiple cursors in the Sources Panel
You can command + click to add multiple cursors in the Sources Panel. You can also undo your last selection with command + u.
Wanna get more?
Upcoming conferences
| Incontro DevOps 2020 |
 Virtual
|
22 October 2020 |
|---|